
Home / Products / Seismology / SQLX
SQLX
SQLX is an indispensable quality control tool for seismologists. By analyzing Probability Density Functions (PDFs) SQLX enables seismologists to identify many quality issues that can have an adverse affect on seismic analysis. An example of the quality issues that can be identified using PDF analysis include:
Site Response Analysis, such as:
- Noise levels across all frequencies
- Minimum noise baseline across all channels
- The existence of human noise sources in the proximity of the station (pumps, trains, vehicles, etc)
- Natural sources of noise (waves, glaciers, weather, etc)
SQLX also offers server side functionality, such as:
- Auto identifying all relevant files - traces and responses
- Read and analyze files (database auto-configured, save metadata and analysis results to database)
- Compute statistics (per channel): Sample rate epochs, system PDFs
- PNG format outputs of system PDFs, spectrograms (per channel)
Following are some sample outputs that demonstrate the utility of SQLX:
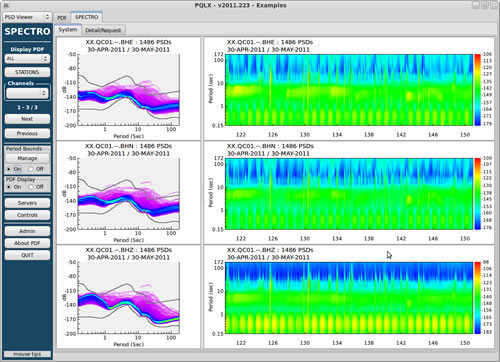
Good Quality Data
This example displays PDF and spectrogram plots representing 3 channels over a one month period. SQLX is able to confirm that this station is producing good quality, useful data.
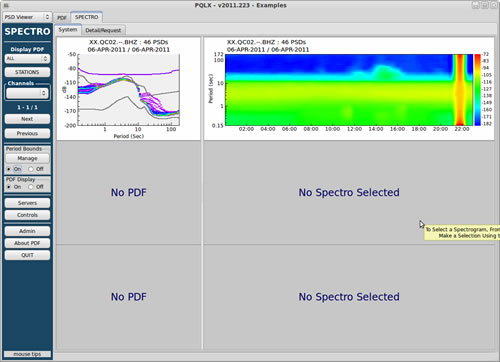
Data Gap
This PDF and spectrogram illustrates the effects of a 10 minute gap in data
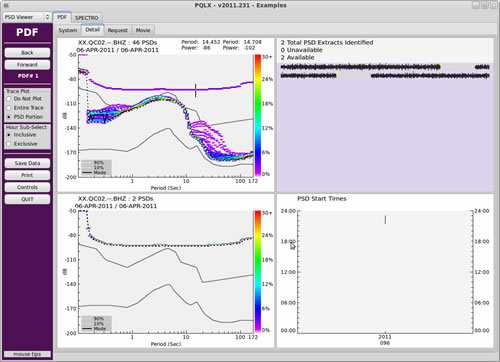
Having identified a gap in the data set, SQLX facilitates a drill-down into the gap in question to display the PSD times where the gap occurred and the gap in the time domain.
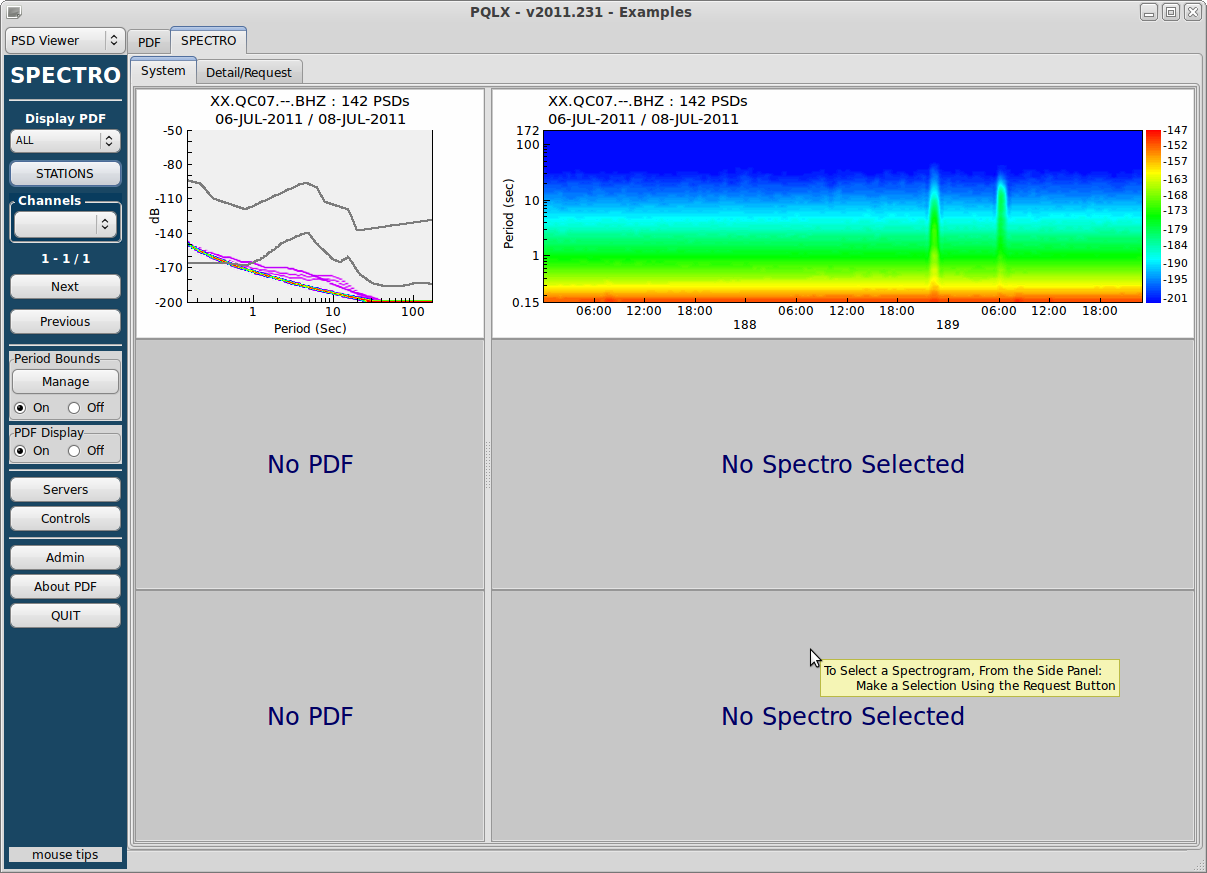
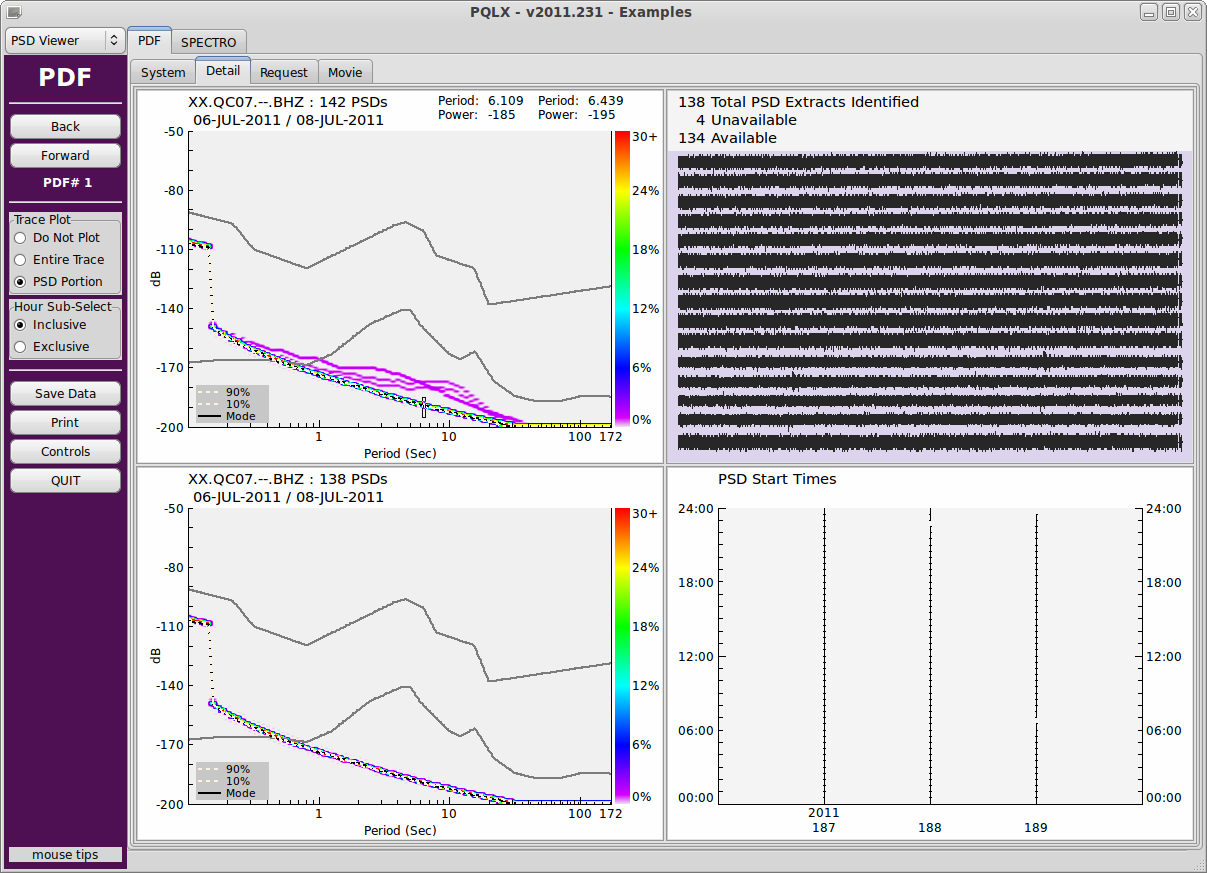
Poor Quality Data
This PDF and spectrogram identify three days of recording with no useful data collected
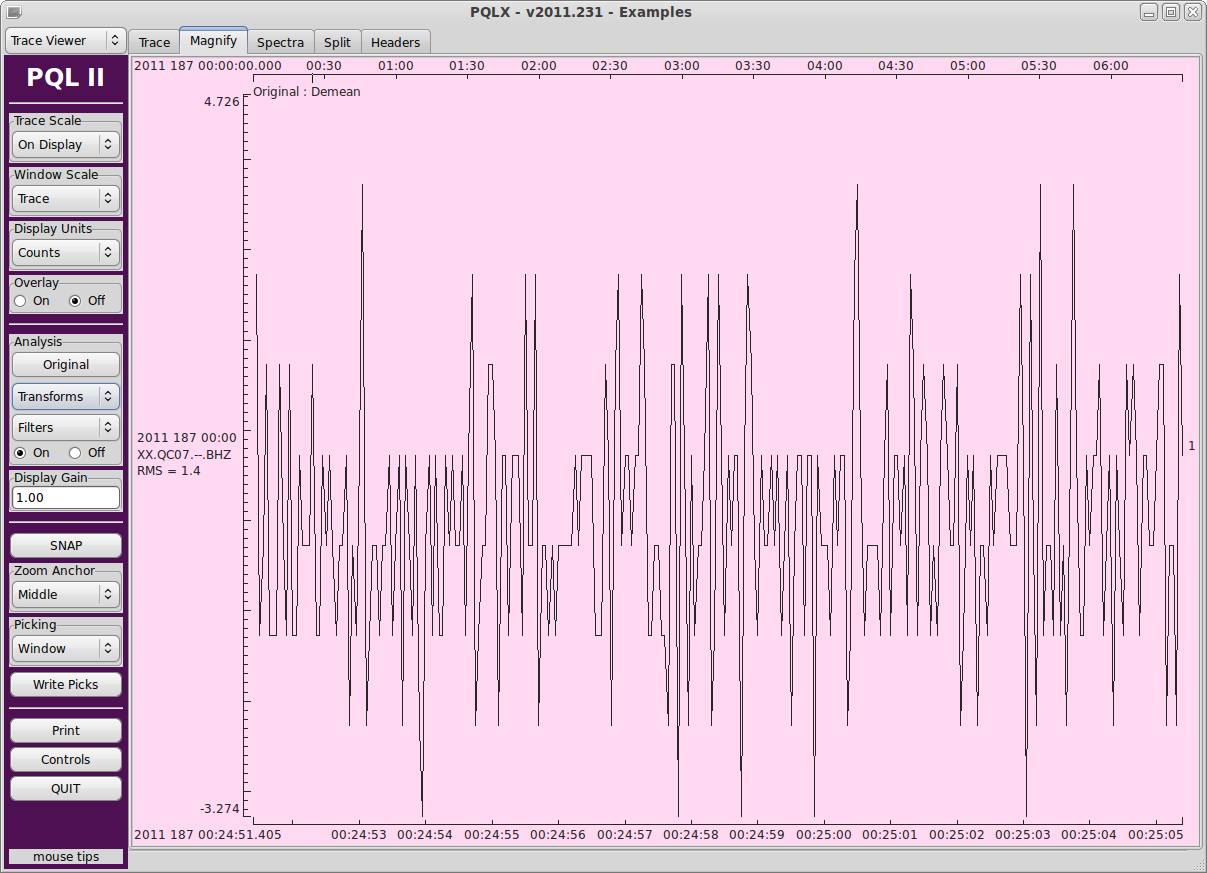
One hour of the trace data magnified, confirming no useful data is being collected.
Magnified portion of time-domain data identifying digitizer noise.
new features!
The collaboration between Boaz Consultancy and Nanometrics has
allowed for many substantial improvements in the functionality of PQLX
which are now available in "SQLX". These enhancements include:
Spectrograms:
- Client-Side Display
- user requests based on user-supplied date range
- zoomable and printable
- optional side-by-side display of corresponding PDF
Server-Side Processing
- Automatic PNG output for same date range as System PDF's
- PNG thumb-nail version also generated (useful for web-page production)
- Previous version provides no spectrograms whatsoever
SQLX Administration Tool:
- SQLX DB Definition, Creation, Modification, and Deletion
- Data Directory Management (Add, Enable, Disable)
- Direct SQLX Server Execution
- Server Log file Output Display
- Event Q Contents Display(allows user to watch the server do its work)
- Execution is Pausable and Resumable
DB Meta-Data/Statistics Display:
- Data Directories
- Station Channels
- Sample Rate Epochs by channel
Server Program Enhancements:
- Server Execution can be scheduled to execute only during a specified time window, automatically starting and stopping until all work has been completed.
- PSD Calculation Parameters now configurable (dB boundaries, window length, period cut off definition, overlap percentage)
- Sample Rate Epochs calculated for each channel
- Allowing System PDF's to be created for all channels for the most recent SPS epoch regardless if a sample rate change has occurred.
Strong-Motion Data Analysis:
- Work on Triggered Data-sets
- dB boundaries higher than standard PDF (range = 10dB to -150dB)
- Period Cutoff at 4 seconds
Client/Display Program Enhancements:
- Fully 64-bit compliant
- More multi-threading employed to increase speed and efficiency everywhere
New Analysis Transforms:
- UVW transform of ENZ components for both STS and Trillium instruments
- Deconvolution of trace data
- Particle Motion Plot of horizontal components
- Sorting now possible on trace format specific header values (SAC, SEGY, AH formats)
PDF Display:
X-Axis displayable in Period or Frequency units
User-defined X-Axis boundary display setting
There are no secrets to success. It is the result of preparation, hard work, and learning from failure.